
About Me
Hi! I’m Willie Conway — a Software Engineer and Data Analyst 👋🏿
I specialize in crafting impactful reports and visualizations for data-driven teams. My focus is on transforming raw data into actionable insights and ⚡automating⚡ reporting workflows. With a strong foundation in technology and military discipline, I’m committed to delivering solutions that save time, improve efficiency, and drive smarter decisions.
Skills

Excel | Tableau | Power BI | Power Automate | SQL | Python
Data Visualization - 4 years
Predictive Models - 4 years
Machine Learning - 4 years
Data Analytics - 4 years
Business Analytics - 4 years
Data Cleaning - 4 years
Dashboard & Reporting - 4 years
Statistical Analysis - 4 years
Featured Projects
SQL | Tableau
Sales Performance Dashboard
Developed an interactive sales performance dashboard using SQL and Tableau to analyze and visualize key metrics, allowing stakeholders to track sales trends effectively.
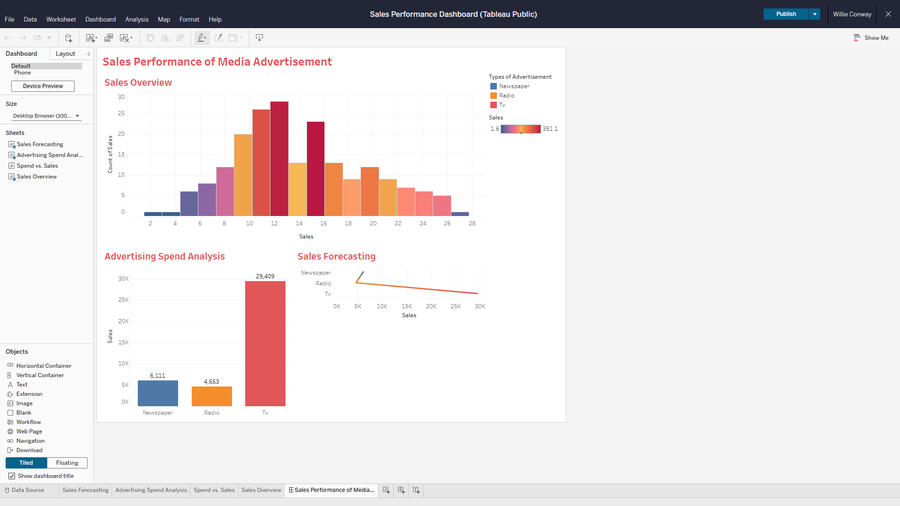
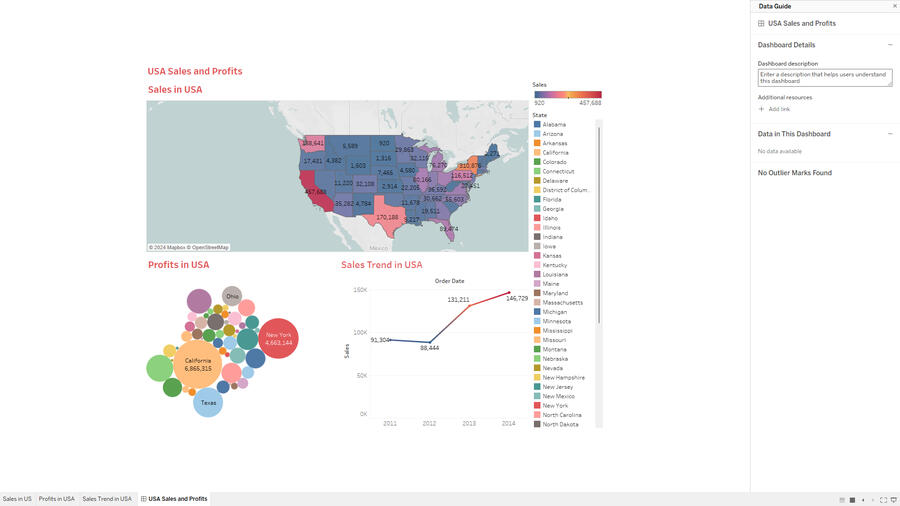
Tableau | Excel
Global Superstore Dashboard
Created an ER diagram and implemented a normalized MySQL database for the Global Super Store, developing a star schema for sales analysis and interactive dashboards.
Python
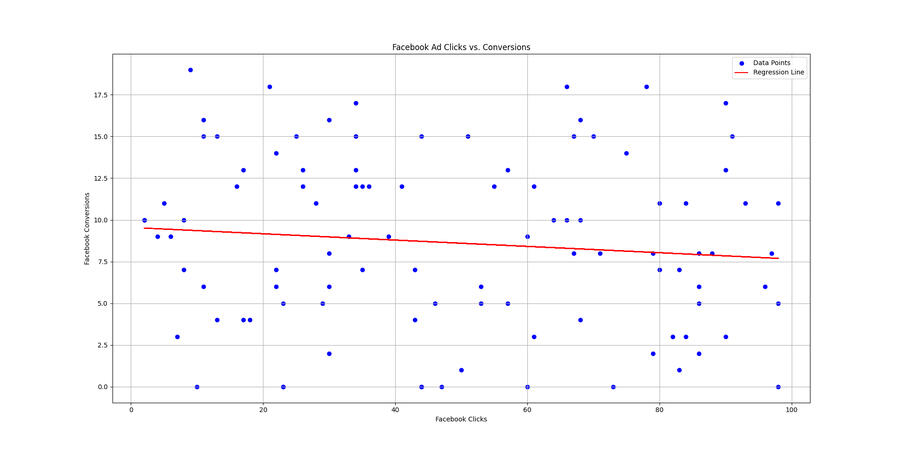
Facebook Ad Conversions Analysis
Conducted linear regression to estimate Facebook ad conversions from clicks, visualizing results and validating model assumptions. Analyzed data using Pandas and Matplotlib.
SQL | Tableau
Little Lemon Database
Project
Designed and implemented a database for the fictional restaurant "Little Lemon," using SQL for data management and Tableau for visualization, providing insights into sales and customer behavior.
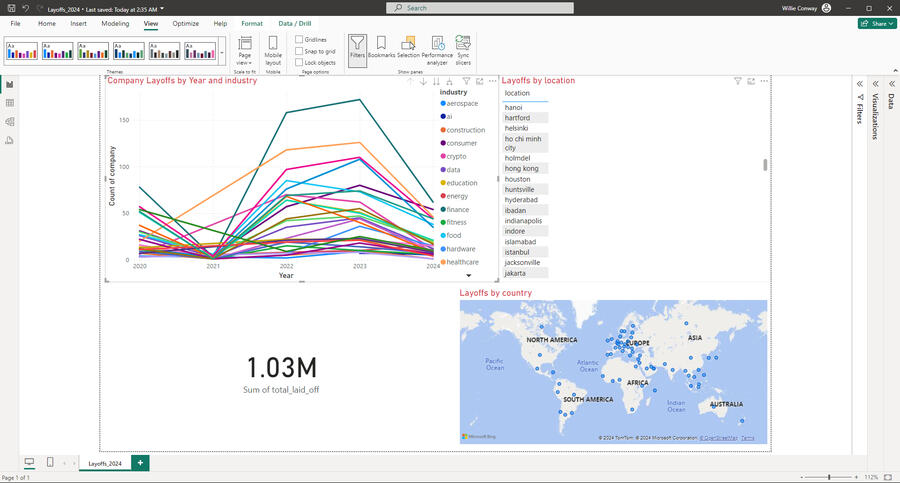
Python | Power BI
Data Cleaning and Preparation
Cleaned and prepared 2020 - 2024 Layoffs dataset for analysis using Python, SQL and Power BI focusing on data normalization and imputation techniques for improved data quality.
Professional Certifications
My growing list of proprietary, project-based certifications.
IBM Data Analyst Professional Certificate | Issued 2025
IBM Business Intelligence (BI) Analyst Professional Certificate | Issued 2025
IBM Data Science Professional Certificate | Issued 2025

IBM Data Engineering Professional Certificate | Issued 2025
Meta Data Analyst Professional Certificate | Issued 2024

Meta Full-Stack Software Engineer Certificate | Issued 2024

Meta Generalist Software Engineer Certificate | Issued 2025
Tableau | Excel
Global Superstore Dashboard
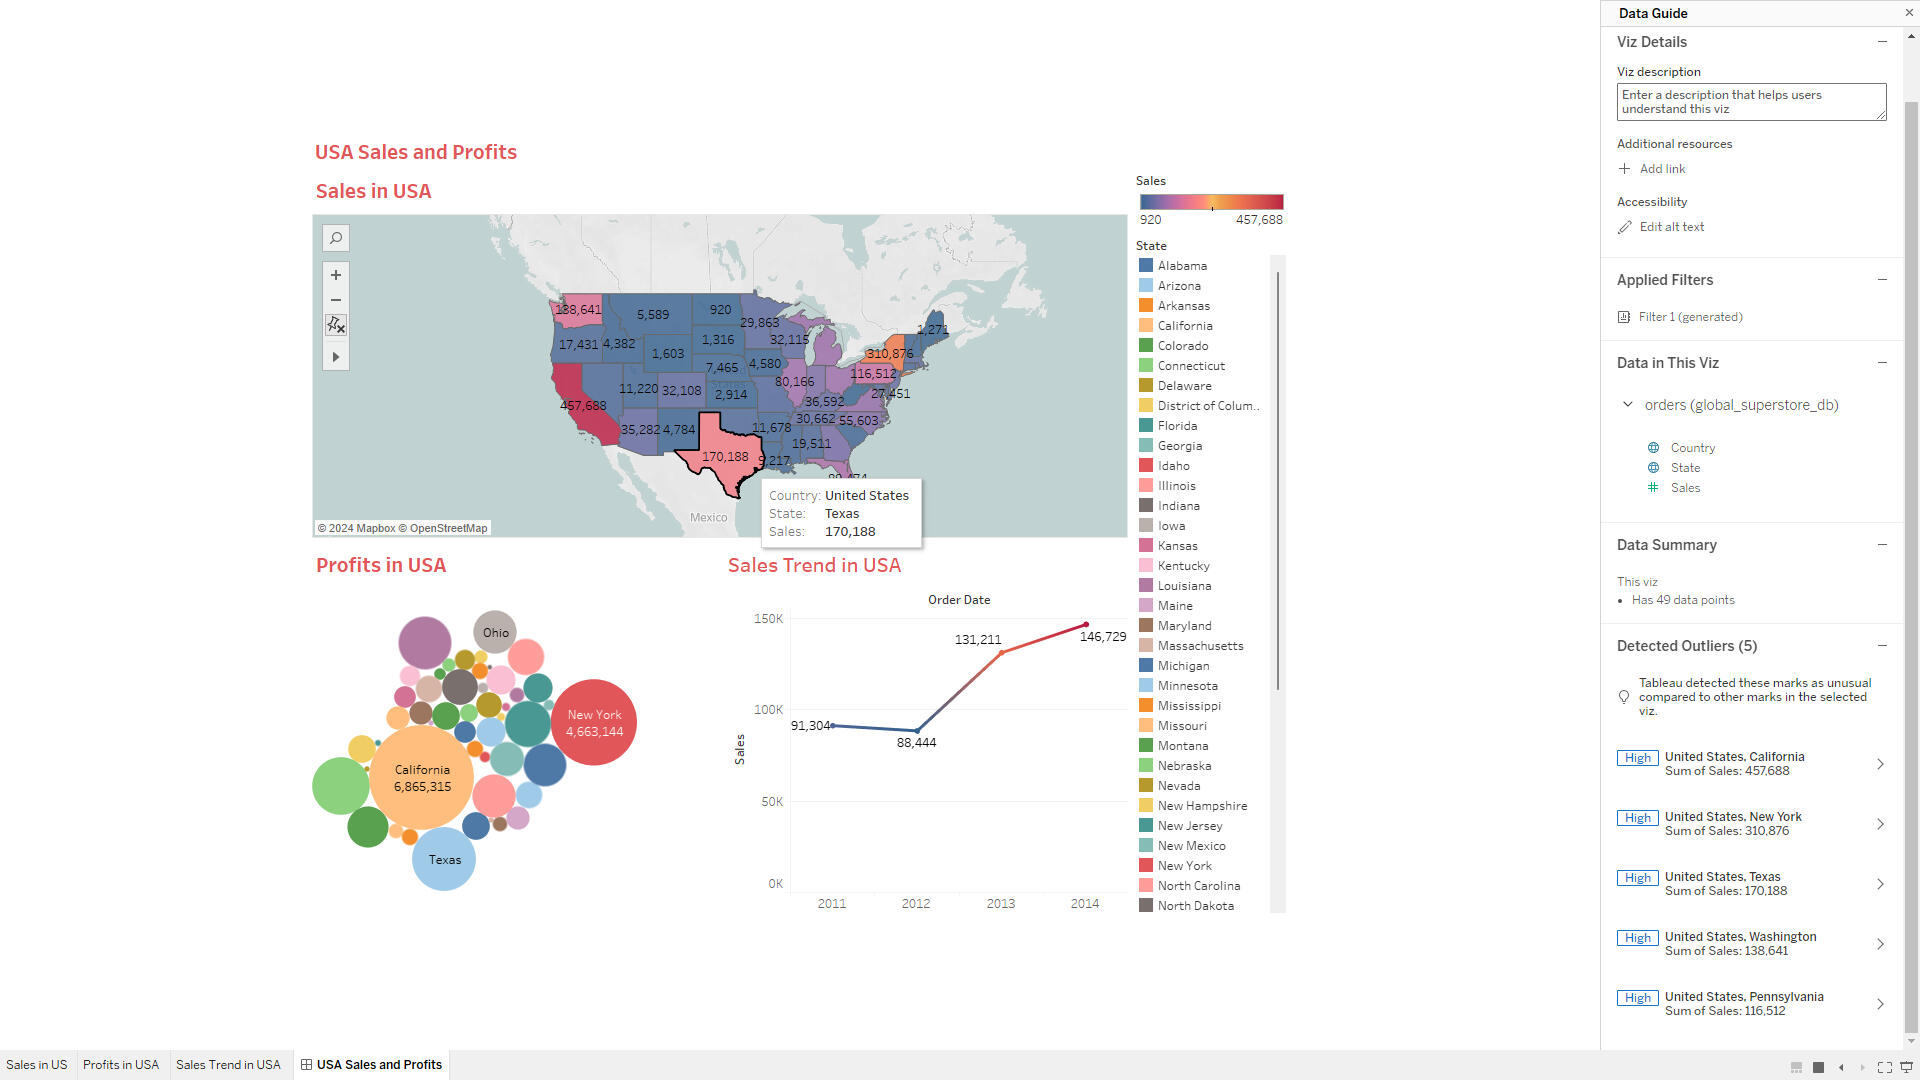
In September 2024, I completed a Data Modeling and Analysis project for Global Super Store. This project involved restructuring their data model and performing detailed analysis on their sales performance.Here are the key questions I was interested in answering:1. How can the data be structured for better analysis and performance?2. What are the sales trends across different regions and states in the USA?3. Which product categories and regions are driving the most profit?4. How can Tableau dashboards be used to visualize sales and profit performance?I took the following steps to complete the analysis:1. Designed an ER diagram to structure the database and ensure normalization.2. Implemented the data model in MySQL using the Forward Engineer feature.3. Created a Star schema to enable efficient dimensional analysis of the data.4. Built interactive maps and charts in Tableau, focusing on sales, profits, and trends across the USA.5. Developed an interactive dashboard that combined all visualizations for dynamic, on-demand analysis.Here are the key takeaways:1. Sales performance varied across different states, with some regions showing higher growth.2. Creating star schemas and structuring data properly helped in analyzing sales by products, time, and location.3. Tableau dashboards allowed for easy interaction with the data, making it accessible for business stakeholders to explore insights dynamically.The final dashboard is interactive, adjusting in real time based on selected filters like regions or product categories.
SQL | Tableau
Little Lemon Database
Project

In September 2024, I completed the Little Lemon Database Project as part of my coursework. This project involved building a comprehensive database system, managing it with SQL, and using Tableau for data analysis to provide valuable insights into business performance.Here are the key questions I was interested in answering:1. How can the Little Lemon database be structured to ensure data consistency and accessibility?
2. How can SQL queries be used to manage and summarize key business data?
3. What insights can be derived from the sales and booking data to improve operations?
4. How can Python be used to interface with the database and automate data handling?
I took the following steps to complete the project:1. Designed the logical data model for Little Lemon, identifying key entities and relationships.
2. Deployed the data model in MySQL using the Forward Engineer method, creating a physical database schema.
3. Developed and executed various SQL queries to manage and analyze data, such as generating virtual tables, joining multiple tables, and creating stored procedures for booking management.
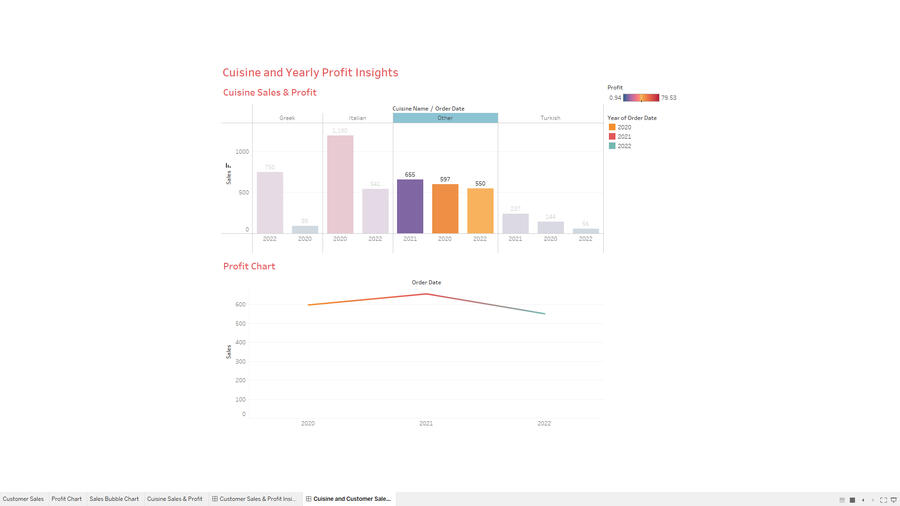
4. Used Tableau to create a range of charts, including bar charts, line charts, bubble charts, and an interactive dashboard for visualizing sales trends, customer data, and cuisine sales.
5. Set up a Python client project to interact with the database, allowing for automated data queries and reporting.
Here are the key takeaways:1. Database normalization and proper relationships between tables were crucial for ensuring efficient data management.
2. SQL procedures helped automate routine tasks, such as making, checking, updating, and canceling bookings.
3. The interactive Tableau dashboard allowed for dynamic exploration of sales and profit data, providing actionable insights for business decisions.
4. Integrating Python with the database streamlined data retrieval and analysis, enhancing the overall efficiency of the project.
The final solution provides a robust and scalable database system, along with powerful analytics and reporting capabilities, all designed to help Little Lemon improve decision-making and business operations.